Understanding the Ascending Triangle Pattern in Technical Analysis
The ascending triangle is a chart pattern commonly used in technical analysis that typically signals a bullish outlook or the continuation of an upward trend. Occasionally, it can also indicate a reversal of a downtrend. This pattern is highly regarded by traders for its reliability and predictive power.
Key Characteristics of an Ascending Triangle
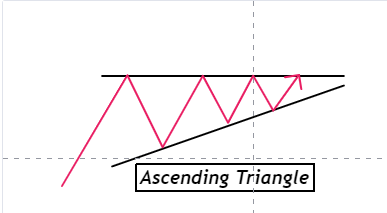
1. Horizontal Resistance Level:
At the top of the pattern, there is a horizontal resistance line. This line is formed by a series of swing highs that reach a similar price level, indicating strong resistance.
2. Rising Support Line:
At the bottom of the pattern, a rising trendline is drawn along the swing lows. This line shows that buyers are entering the market at progressively higher prices, which is a bullish signal.
3. Price Behavior:
Within the ascending triangle, the price creates higher lows while repeatedly testing the horizontal resistance. This consolidation phase continues until the price eventually breaks through the resistance level, leading to a continuation of the uptrend.
Breakout Scenarios
1. Upward Breakout:
More often than not, the price breaks through the horizontal resistance level at the top of the triangle. This breakout signals the continuation of the upward trend, confirming the bullish outlook of the pattern.
2. Downward Breakout :
If the price breaks below the rising support line, it can indicate a change from an uptrend to a downtrend. Although less common, downward breakouts are considered more reliable due to the strong bearish signal they provide.
Estimating profit Targets.
To estimate a profit target using the ascending triangle pattern, traders can add or subtract the height of the triangle from the breakout price. The height is measured at the thickest part of the triangle (the distance between the initial swing high and swing low when the pattern started forming).
Example: If the height of the triangle is ₹400, you can add ₹ 400 to the breakout point for an upward breakout to determine the price target. Similarly, for a downward breakout, you subtract ₹ 400 from the breakout point to estimate the target.
Summary
The ascending triangle is a valuable tool in technical analysis, providing clear signals for potential price movements. By understanding its characteristics, breakout scenarios, and methods for estimating profit targets, traders can make informed decisions to capitalize on market trends.